

Greater Manchester will move to the top COVID alert level from Friday, putting 2.8 million people under the toughest restrictions.
During a news conference on Tuesday evening, Boris Johnson confirmed the region would enter Tier 3 – meaning measures that will force more businesses to shut.
The decision came after 10 days of talks with local leaders ended without a deal, with Greater Manchester's mayor Andy Burnham having led calls for greater financial support than what was on offer from the government.

Mr Johnson said he "regretted" having to impose COVID-19 rules that would close down many businesses.
But he added: "Given the public health situation, we must proceed because not to act will put Manchester's NHS, and the lives of Manchester's residents, at risk."
Advertisement
During the conference, the PM was joined by England's deputy chief medical officer Professor Jonathan Van-Tam, and Professor Stephen Powis, medical director of NHS England.
Together they laid out how the virus is surging in Greater Manchester and why the latest restrictions are needed.
More from Covid-19
Professor Van-Tam showed a series of heat maps and graphs showing how coronavirus is spreading in the region, particularly among the elderly and more vulnerable groups in the population.
He said coronavirus cases are rising among the over 60s, putting pressure on the NHS, but that there are "very significant" areas of heat across "pretty much all ages".
"The infections that have seeded in the younger age groups are now penetrating the older age groups," he said.
"This is most concerning because it is the penetration of the disease into the older age groups that give the NHS significant problems."
Professor Van-Tam said the delay in reaching an agreement on restrictions had had an impact on the spread of coronavirus in Greater Manchester.
Giving the 60-plus age category as an example, he gave case numbers per 100,000 between 1 October and 7 October and then between 8 October and 14 October.
In Manchester initially, there were 302 cases per 100,000 – this became 326 per 100,000.
In Salford, there were 164 cases per 100,000 – this became 287 per 100,000.
And in Wigan, there were 207 per 100,000 – this became 399 per 100,000.
He said the figures gave some idea of the "rapid rate" at which the virus spreads.

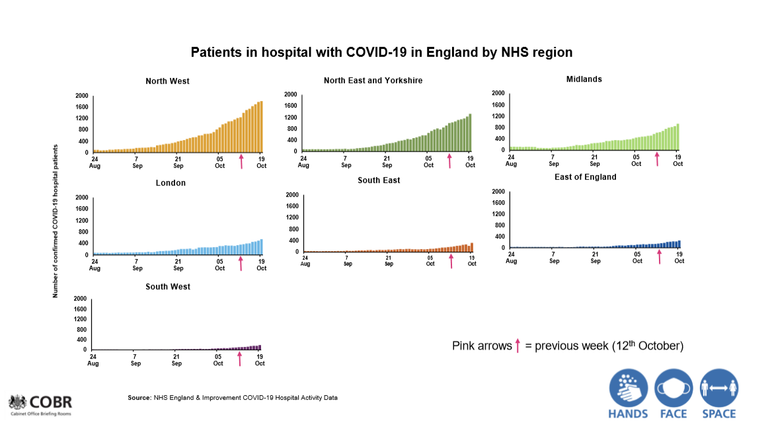
Professor Powis said this "doubling effect" was obvious in the numbers of people in hospital with COVID-19.
He said there were 330 people in hospital with the virus two weeks ago. On Monday, there were 620.
Using this example, he said in another two weeks there could be 1,200 patients. During the first wave on 18 April, there were 1,277 people in hospital in Greater Manchester.
"We could well be seeing the sorts of numbers in Greater Manchester we saw at peak in April," he added.
Professor Powis also said there are "more patients in hospitals in Greater Manchester alone than are in hospitals in the entire South East and South West of the country".
He said with "more deaths" there are "more hospital admissions" and more people developing symptoms.
"We also know COVID can aRead More – Source
[contf]
[contfnew]

sky news
[contfnewc]
[contfnewc]


